thutson3876


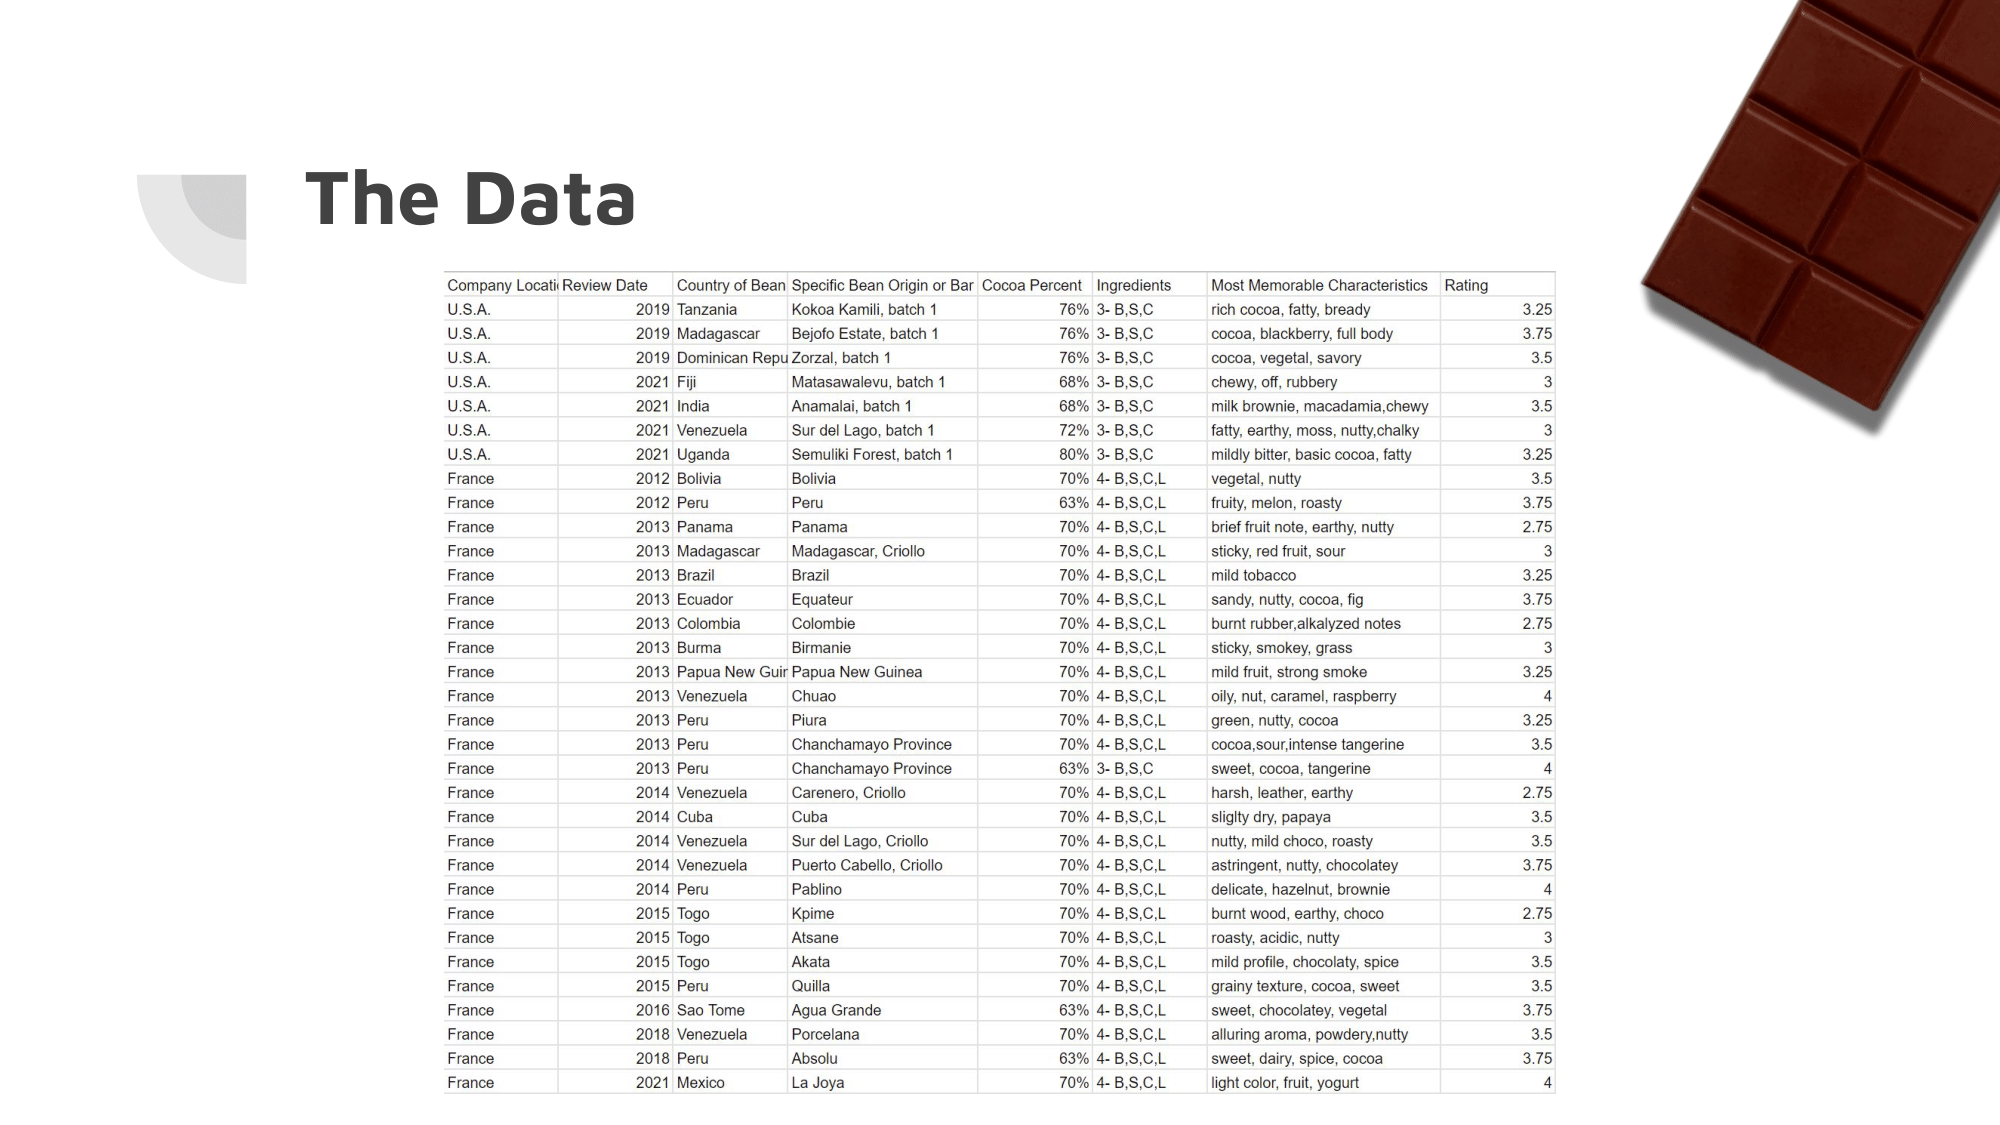


Above is a Computer Science final project presentation about data analysis of a Kaggle dataset about various chocolate bars.
The dataset had many dimensions, and sub-categories within them that made preprocessing of the data absolutely crucial. It had been approached by others before, but each approach had flaws with either the implementation, or the results.
After preprocessing the data, we trained a variety of machine learning (ML) algorithms with the data.
Bitter chocolate is so unjustly hated!
Development Tasks
- Training Multiple Machine Learning Algorithms
- Adjusting Criteria for Better Accuracy
- Data Pre-Processing
- Python Programming
Previous Approaches
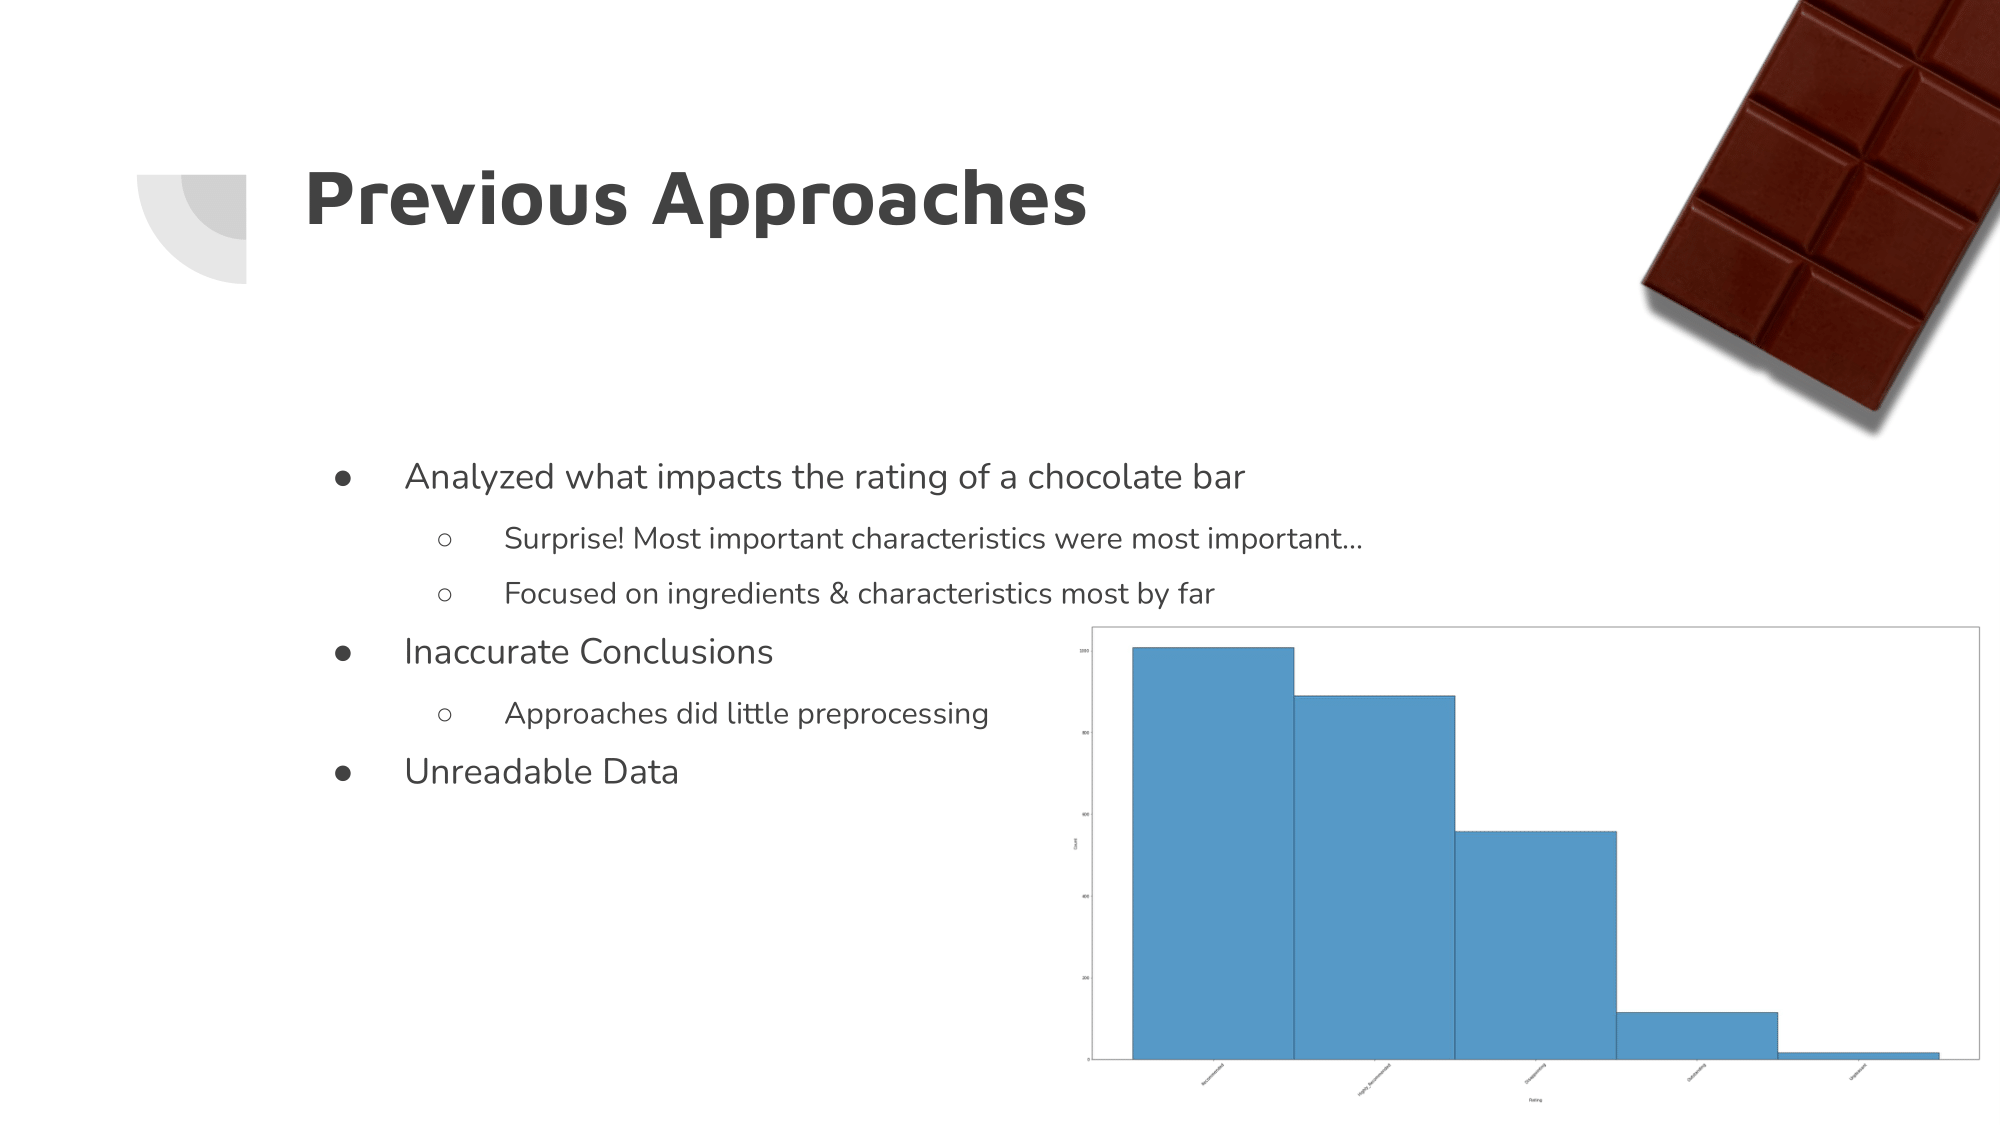
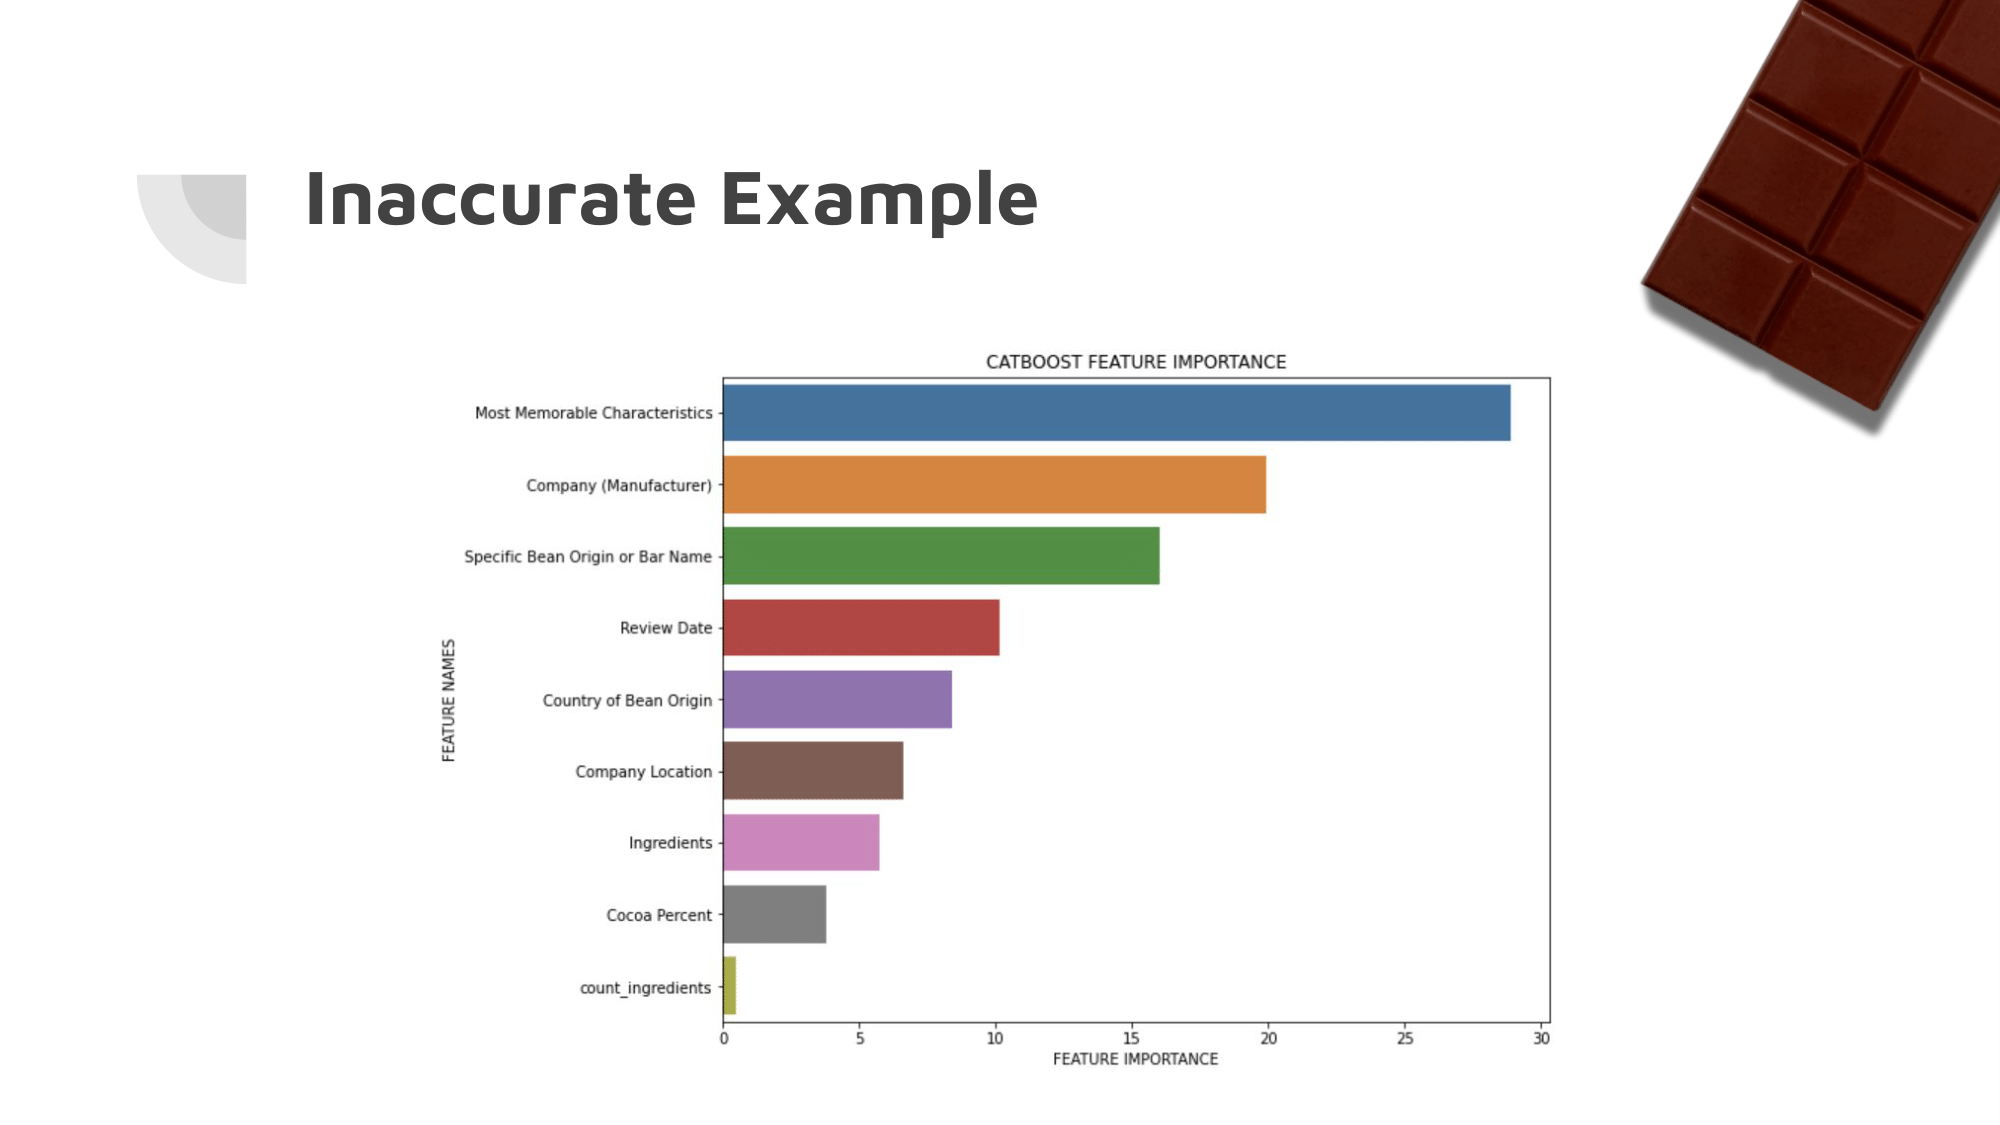
While some approaches had already been made, most were either unhelpful or inaccurate due to a lack of preprocessing on the data.
The most important category, memorable characteristics, had sub-categories that went completely ignored by most people working with the dataset.
Our Approach: Preprocessing

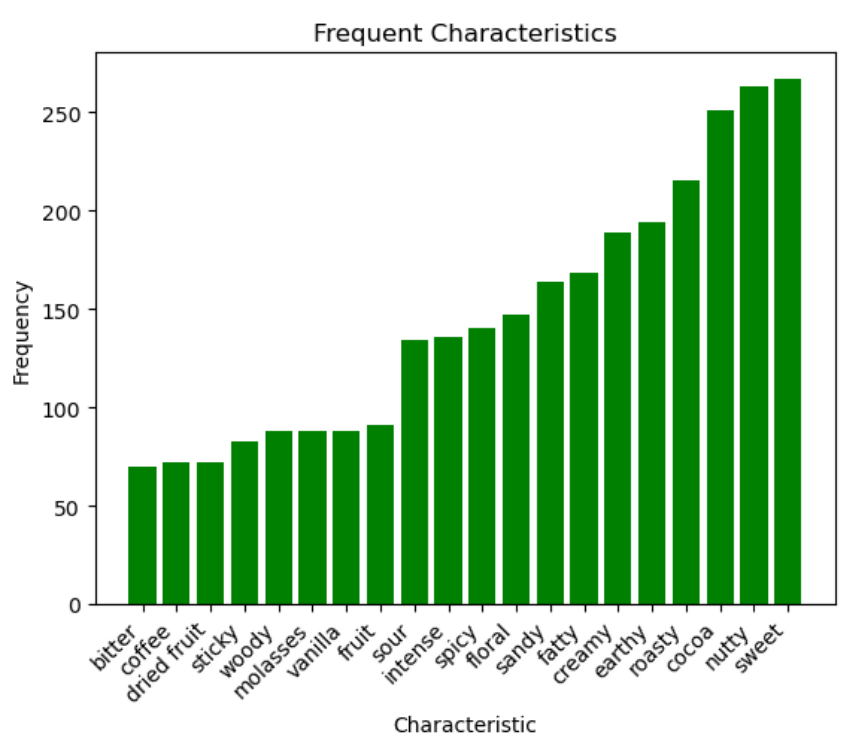
Within the memorable characteristics column, there were over 1,000 different unique strings that were used to describe chocolate bars.
By looking at the elbow graph, we were able to determine a point where removing any characteristics below that amount barely effected the data, while reducing the amount of dimensions by more than five times.
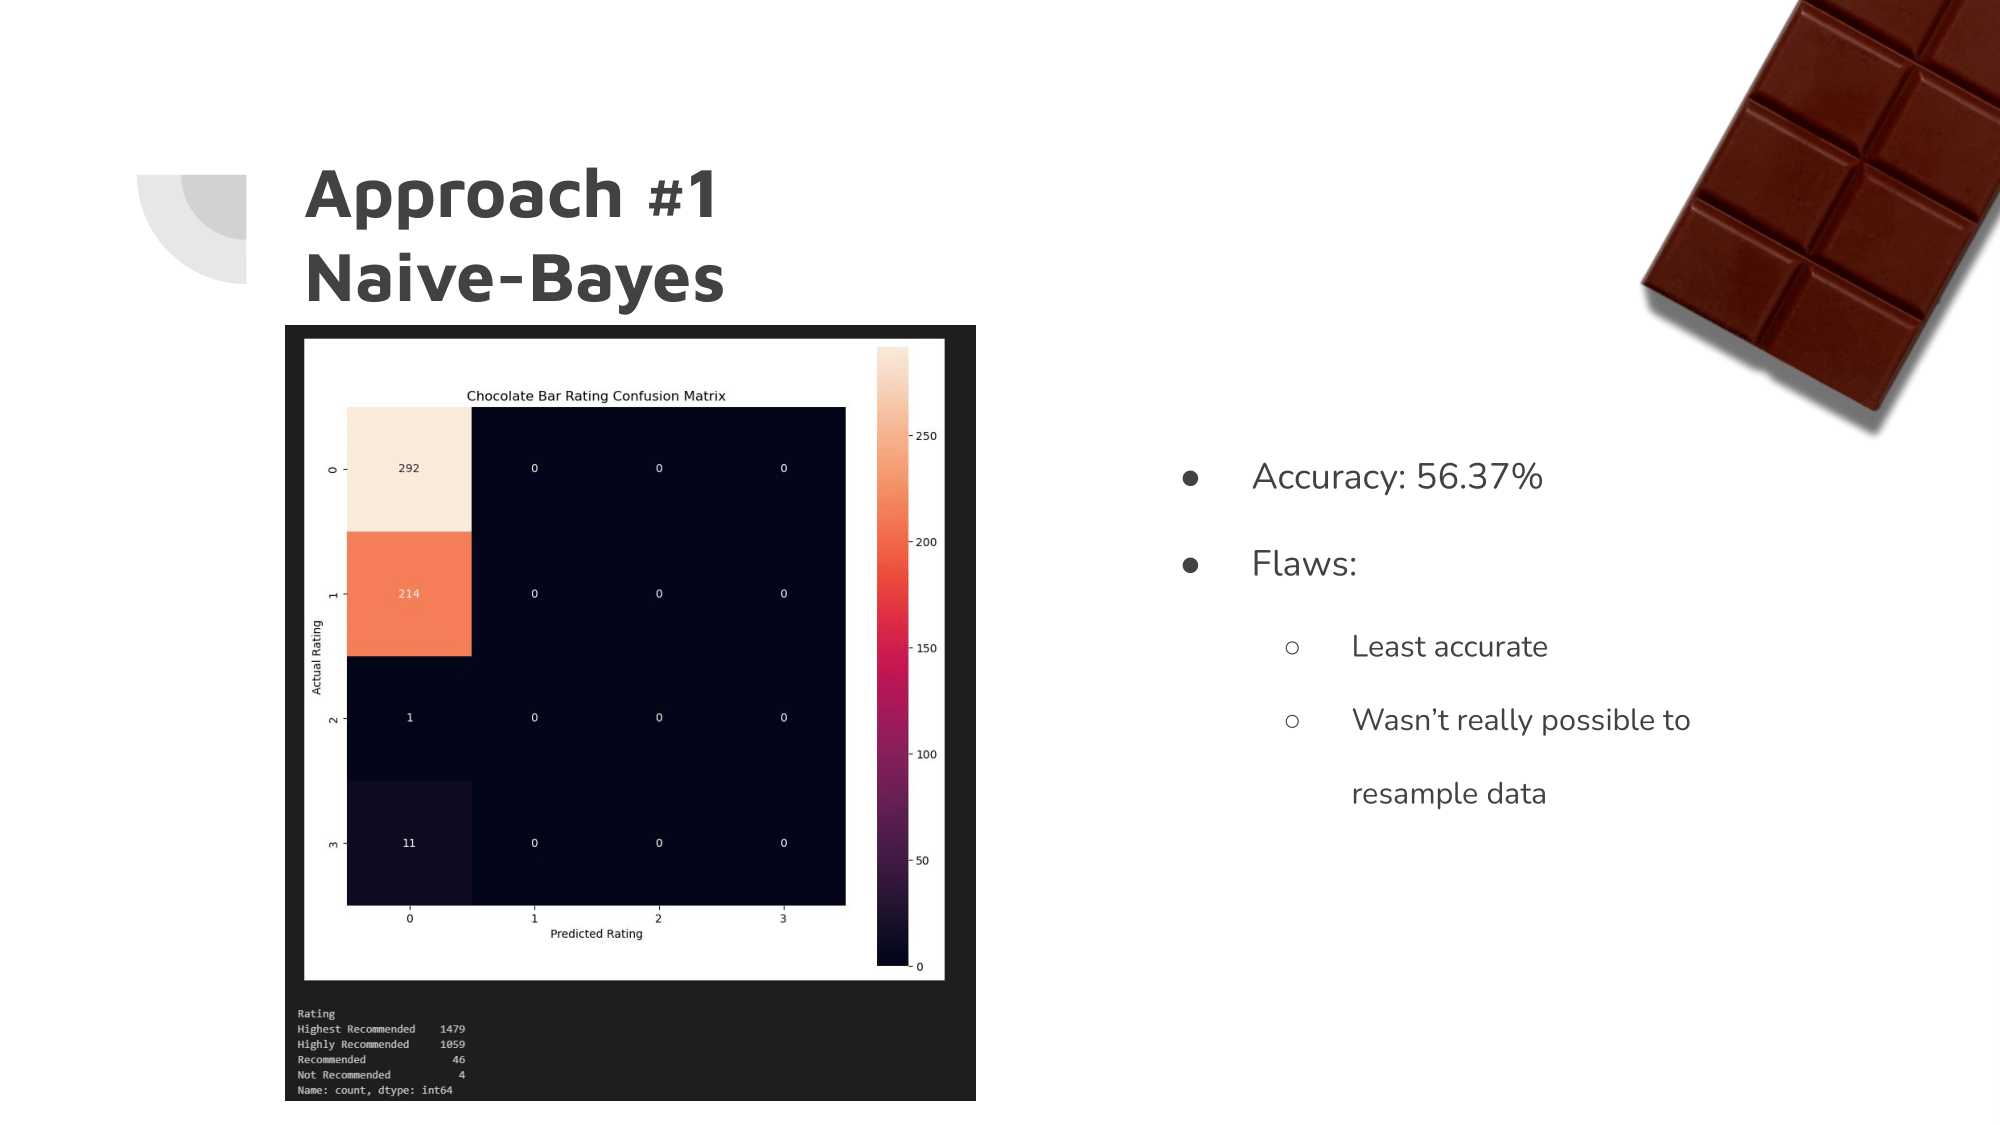
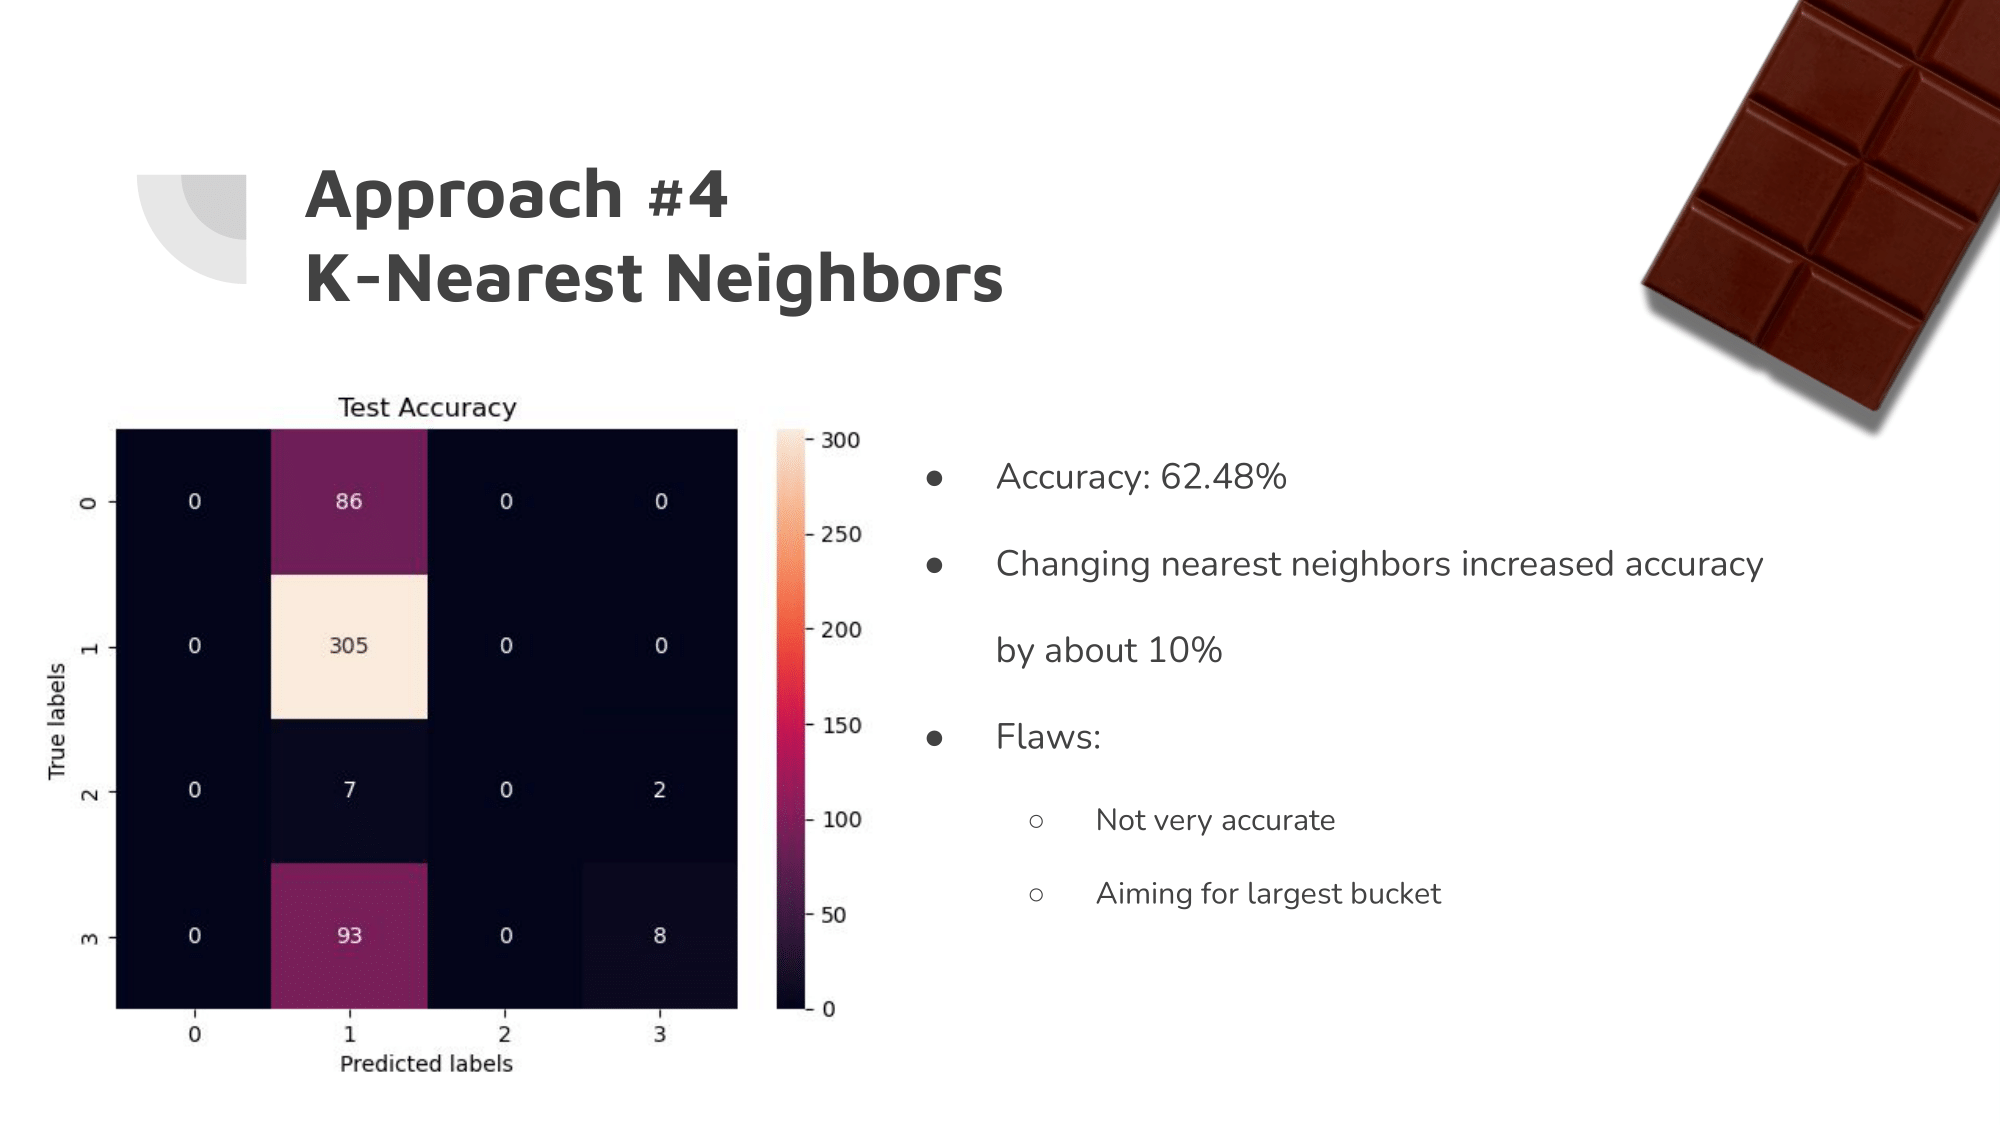
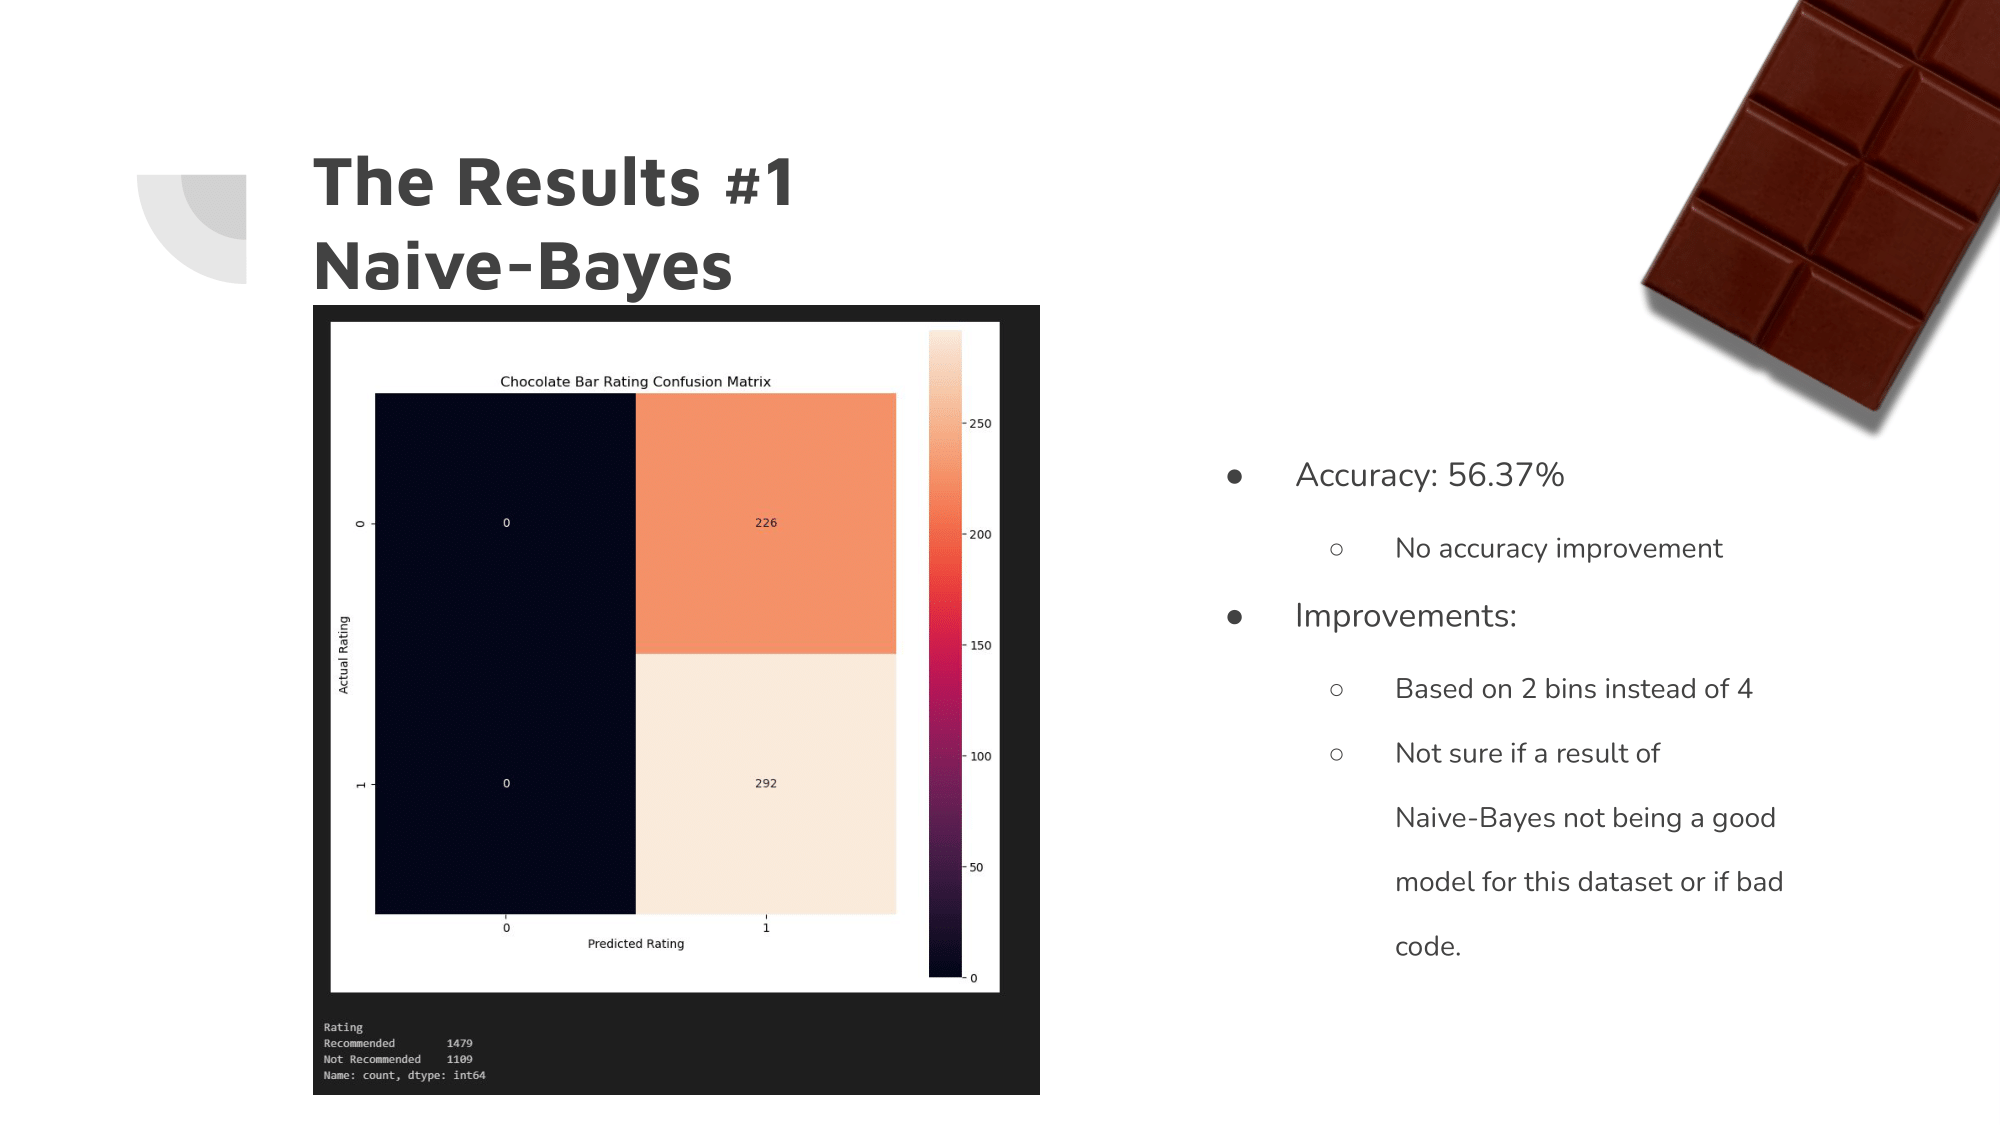
Our Approach: ML Algorithms
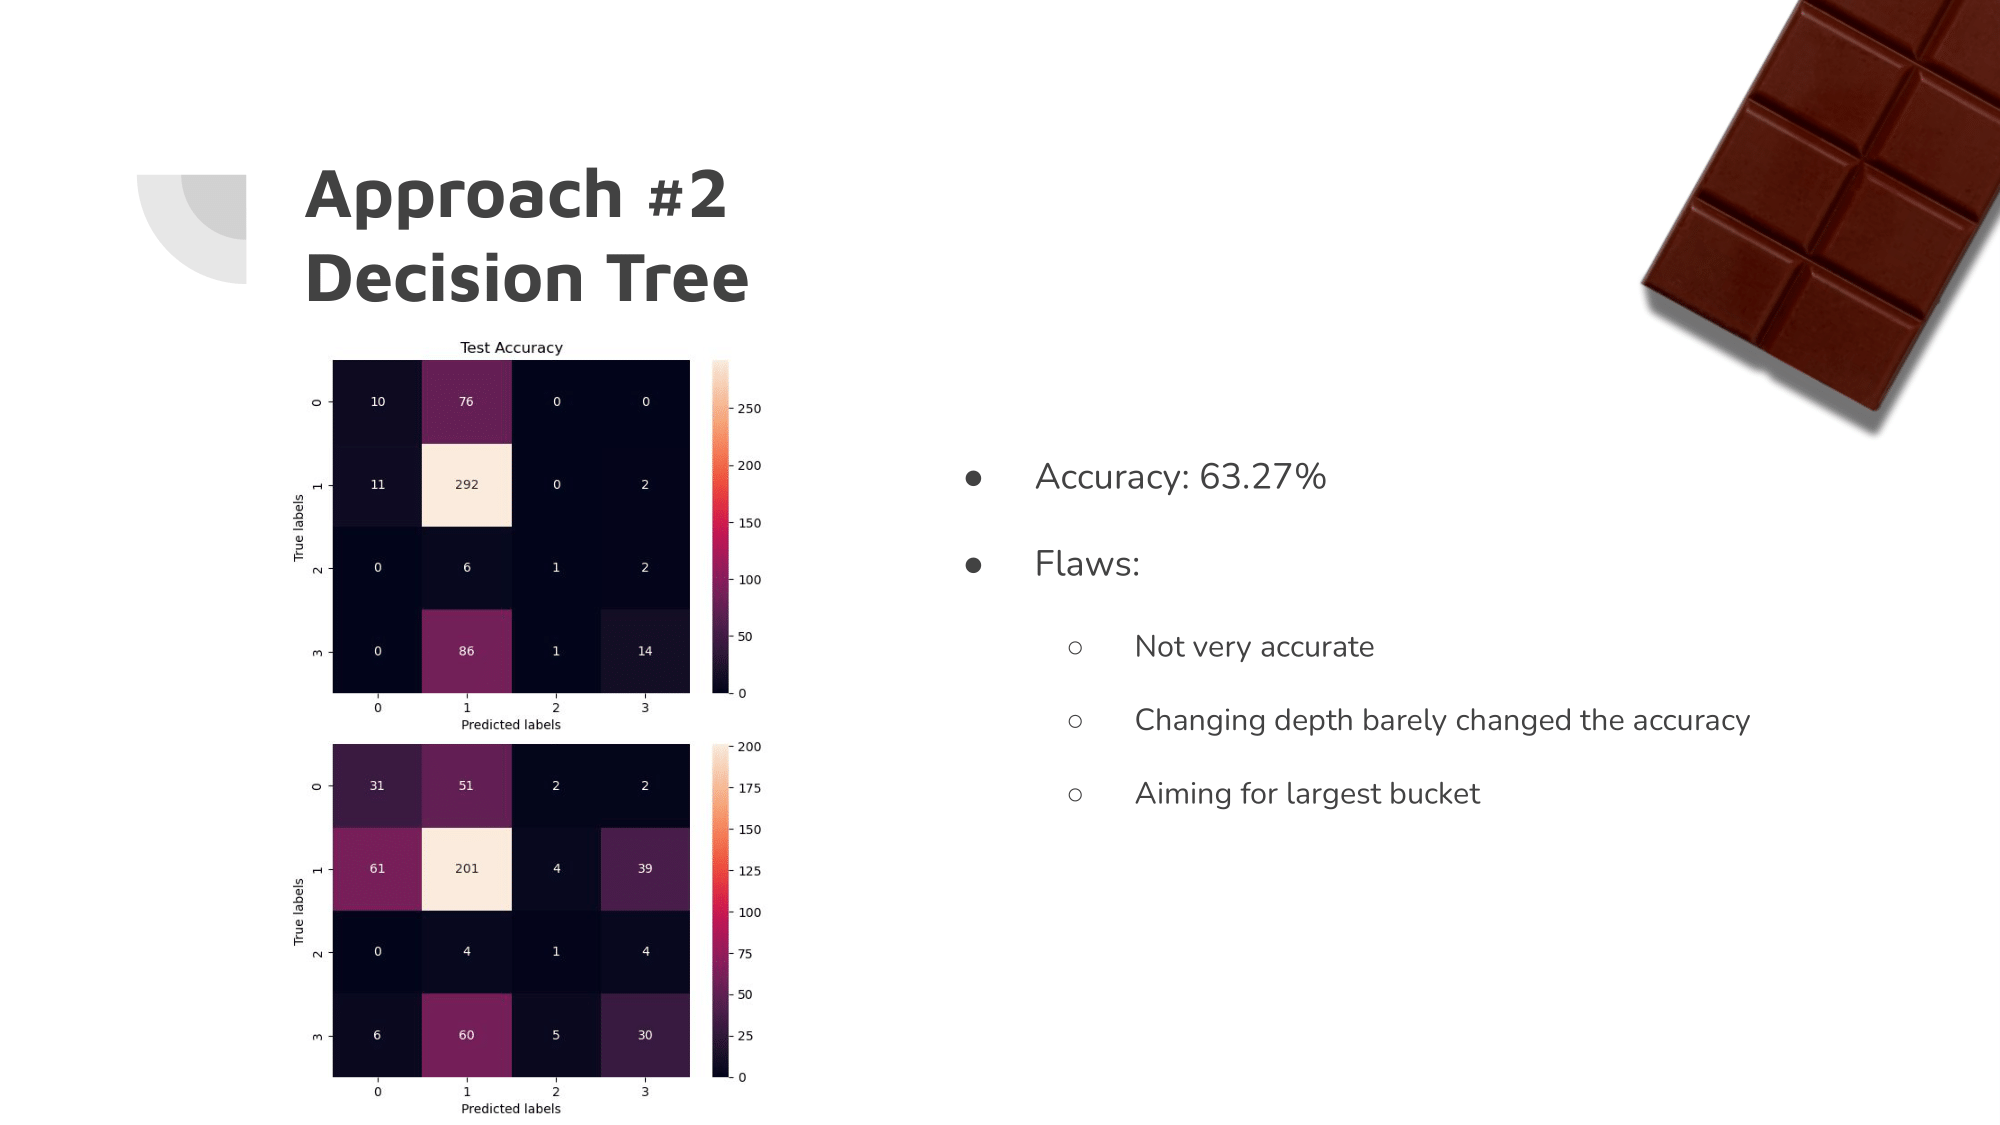
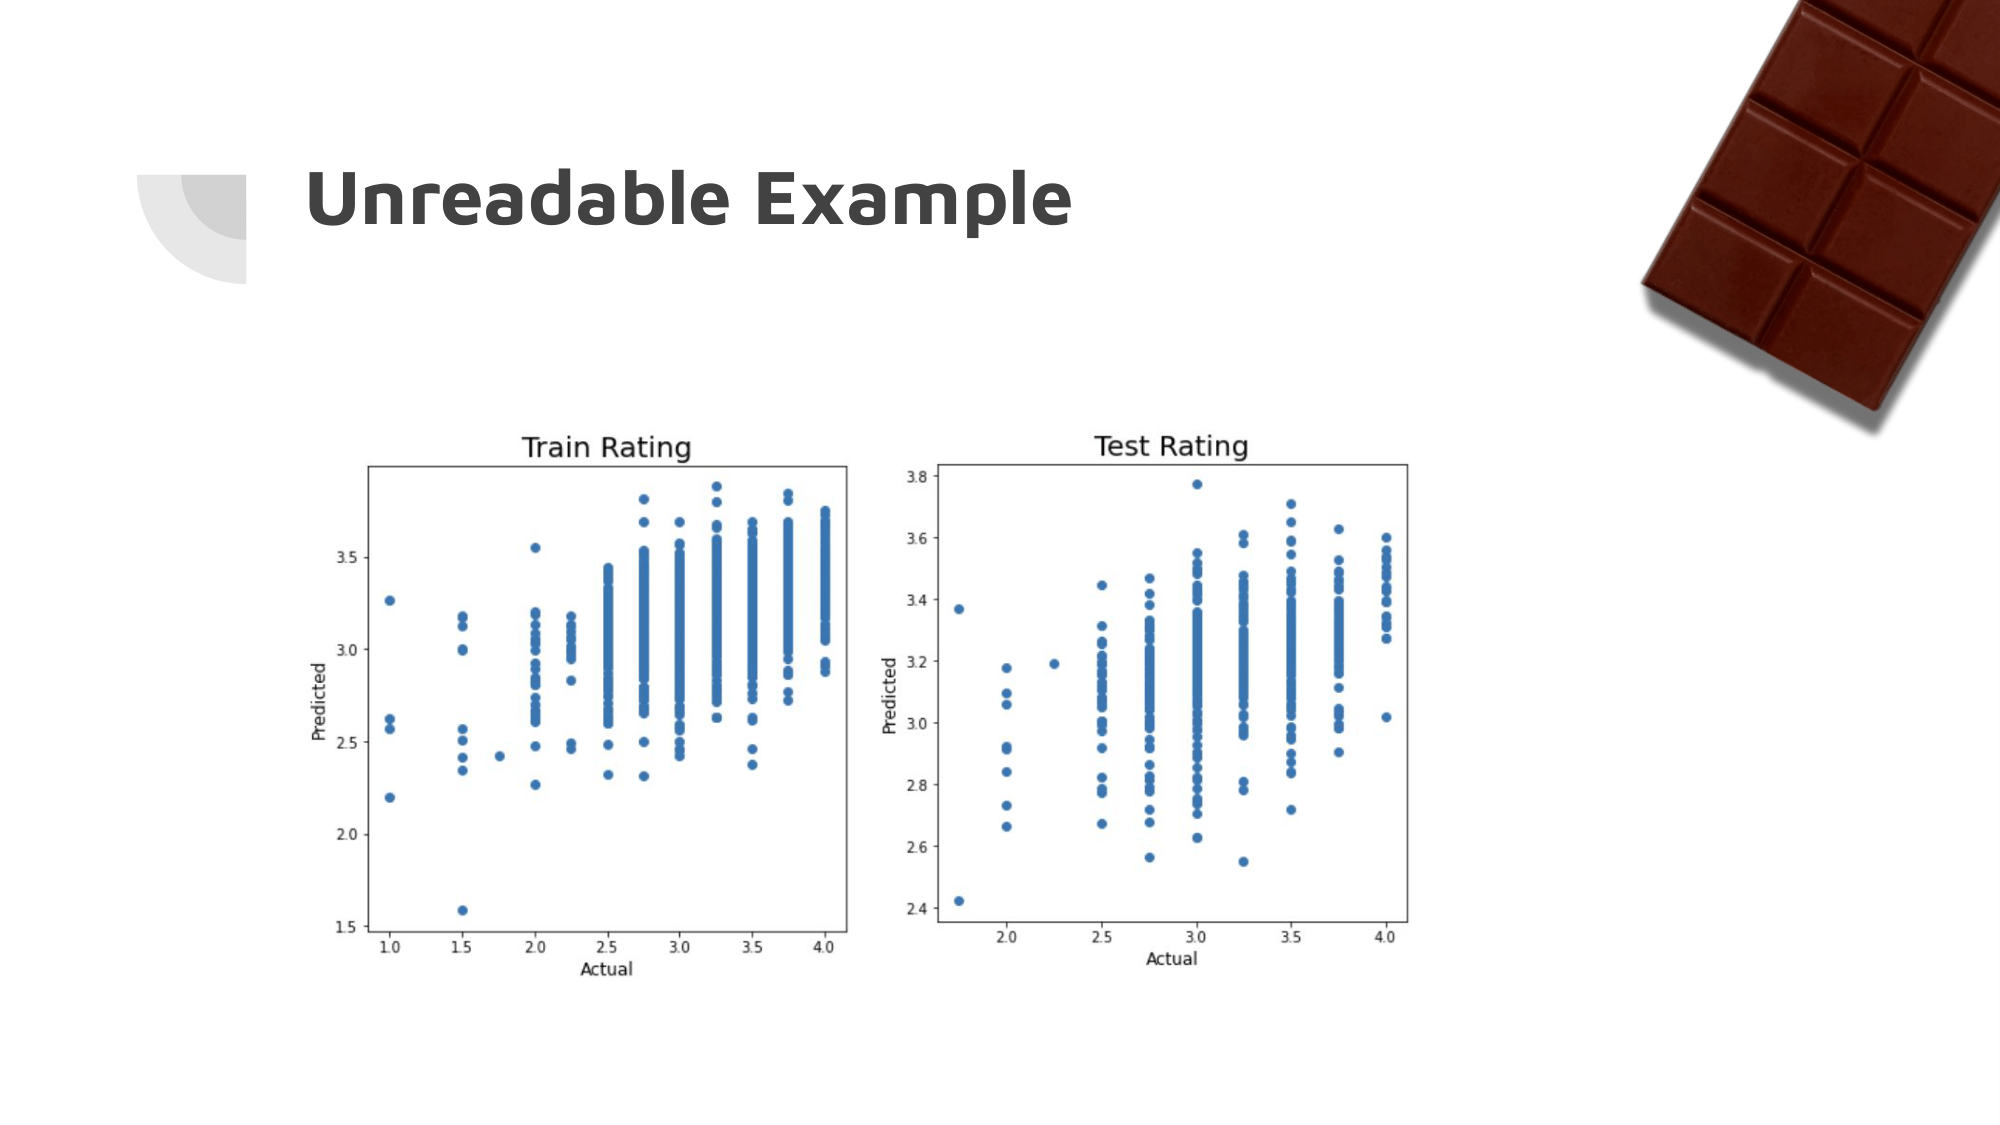
Our initial ML algorithms were not very accurate. It was clear that they were each aiming for the largest of the buckets.
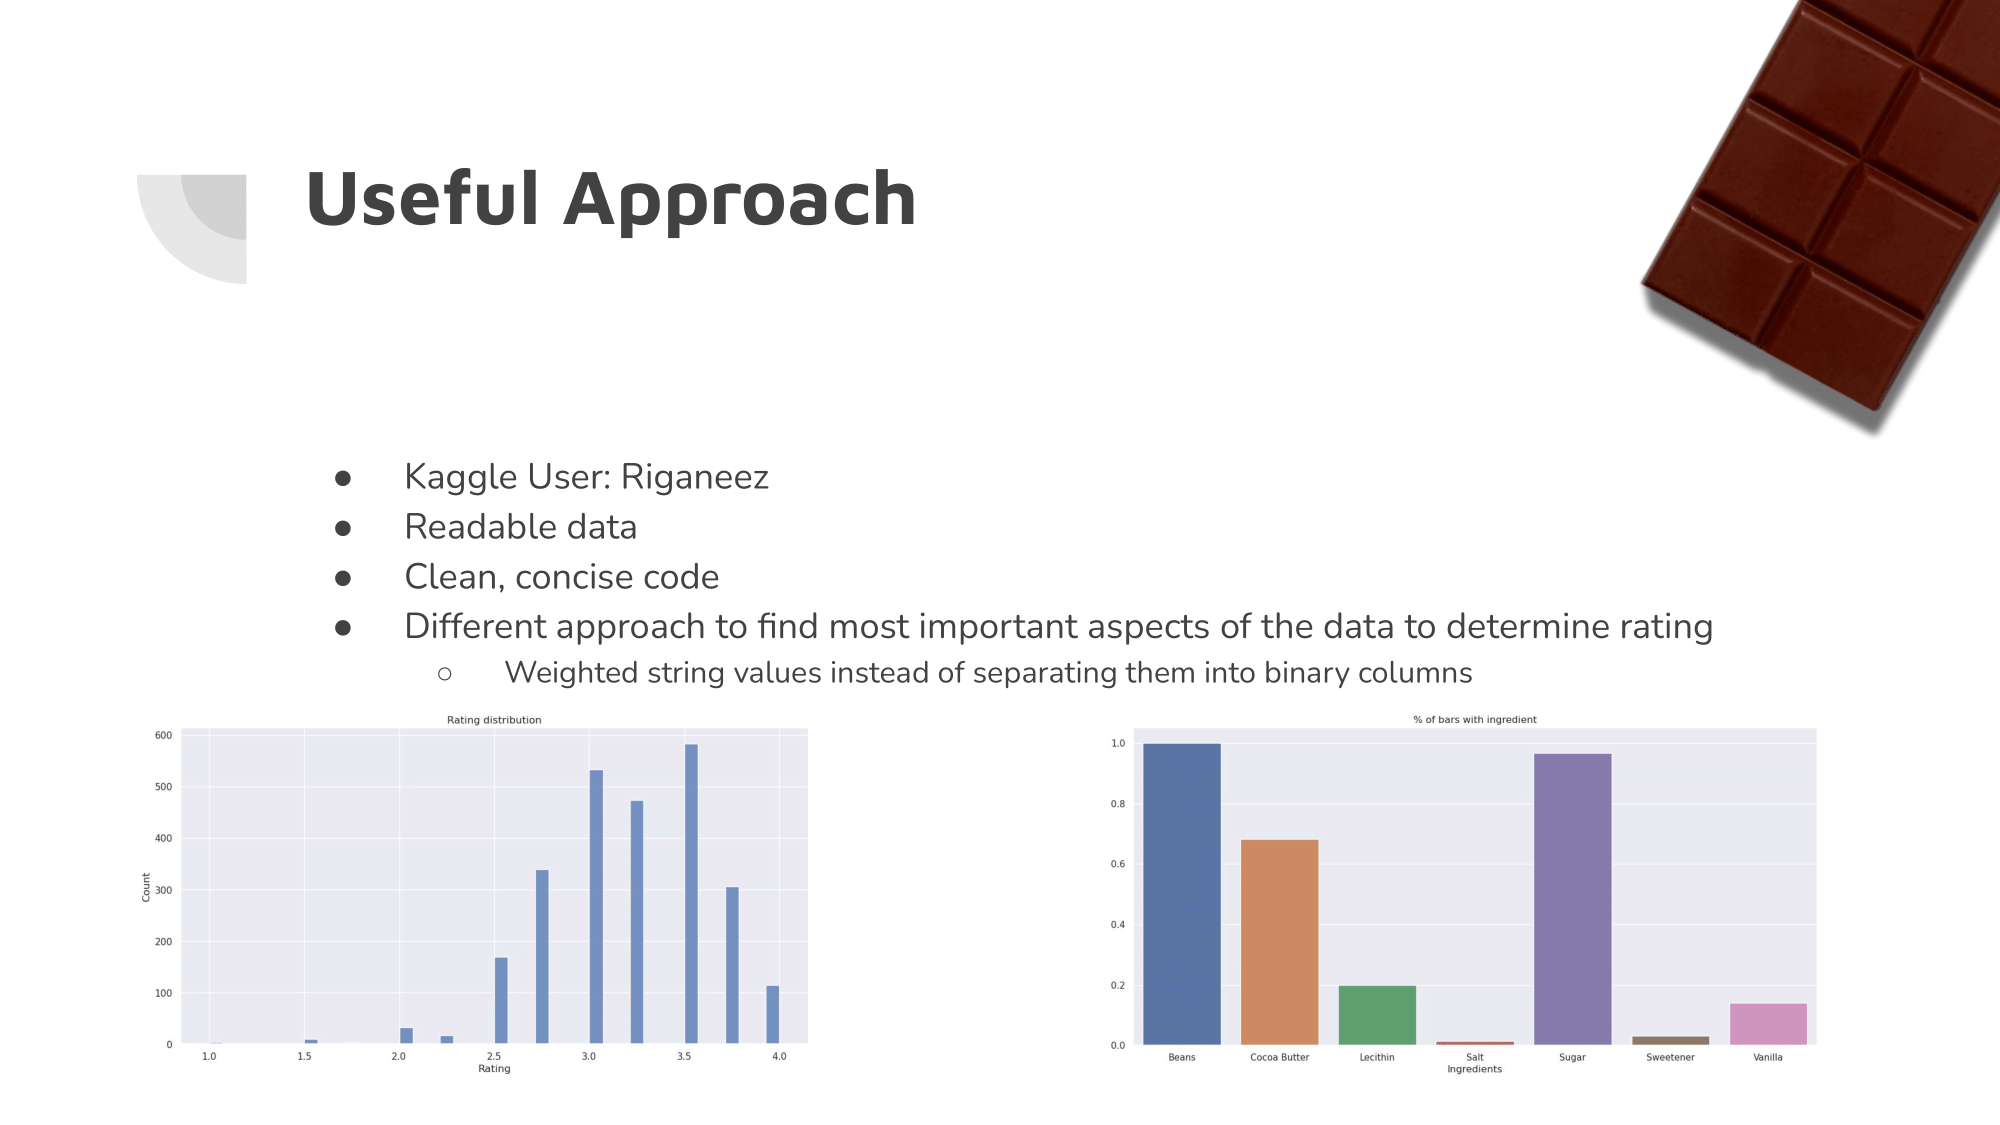
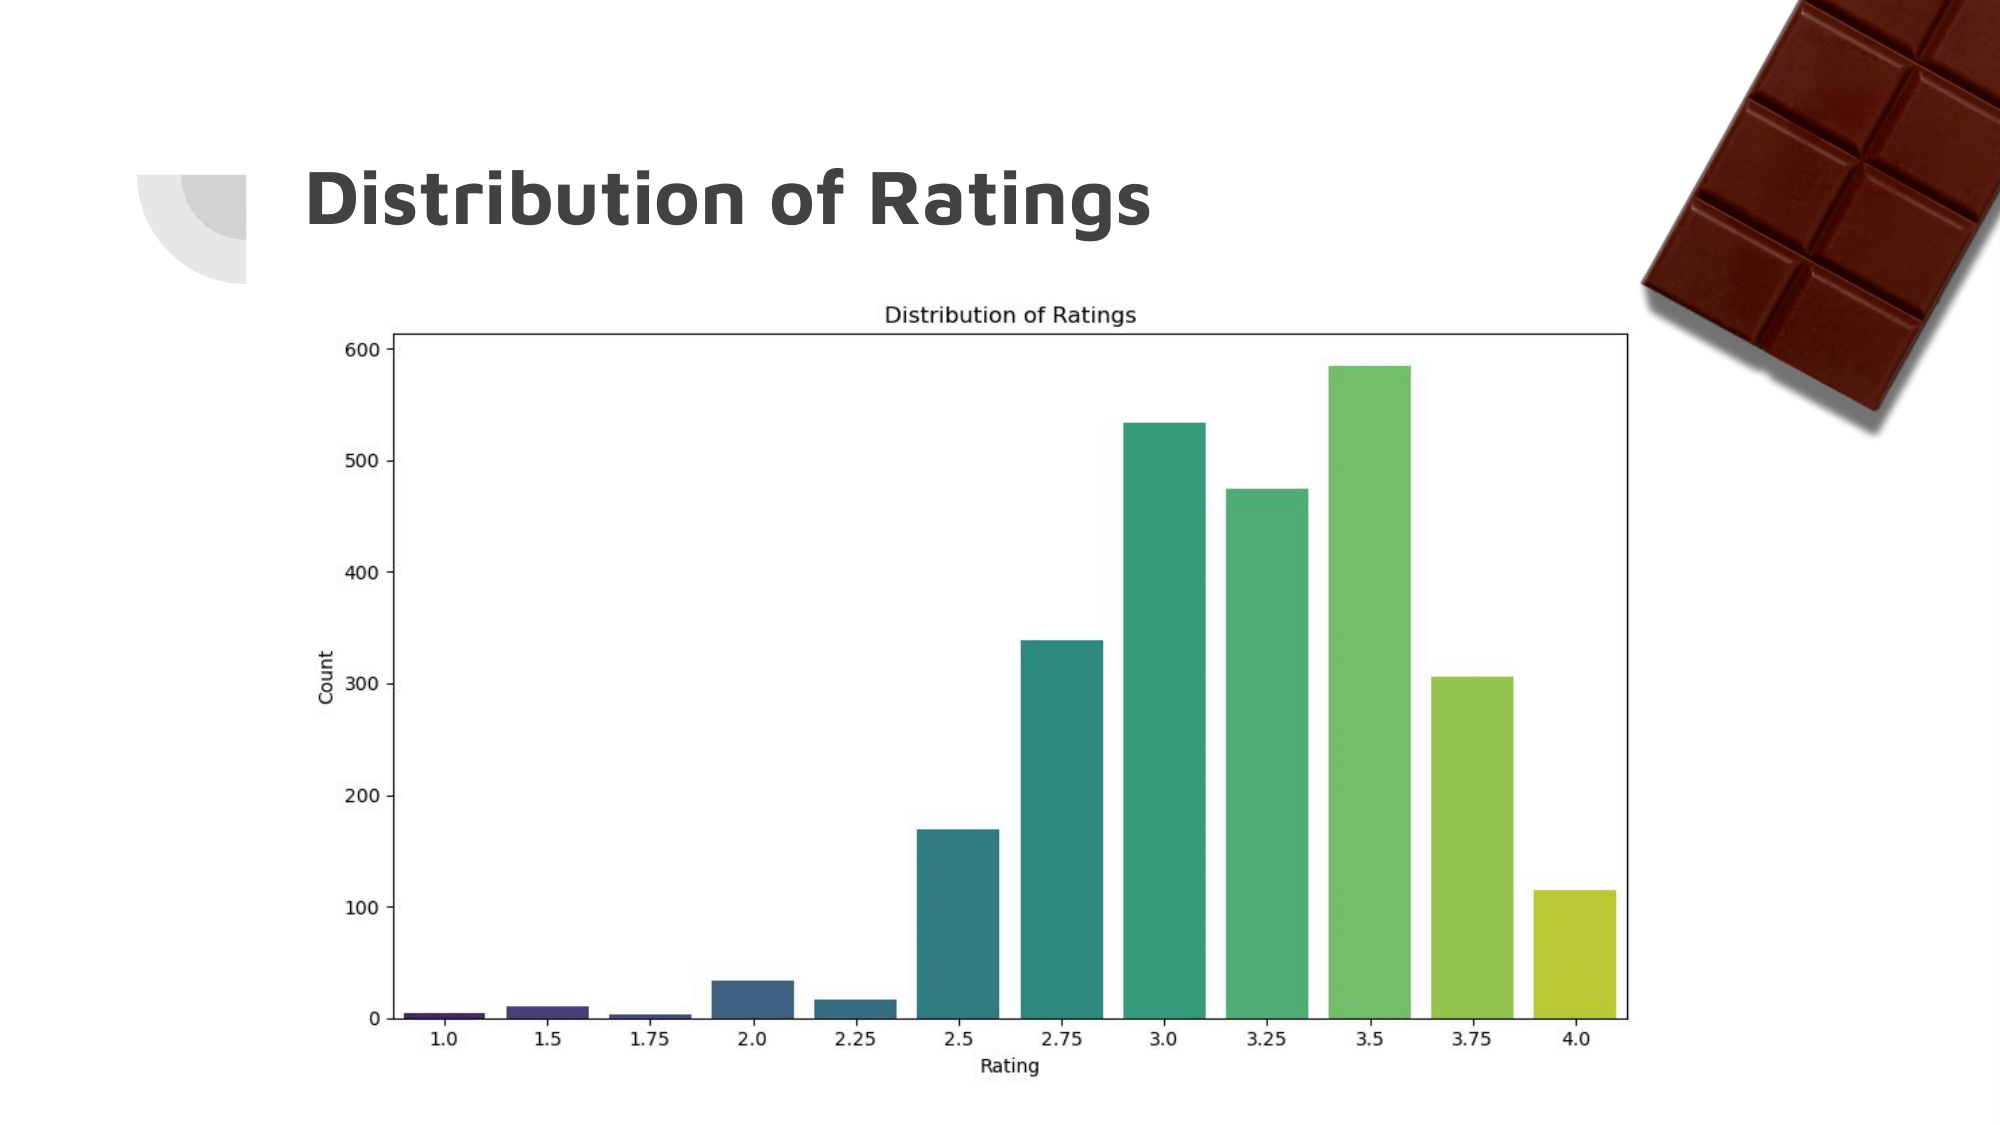
Since the vast majority of the ratings were between 2.5 and 3.5, the algorithms simply guessed a rating between those most of the time.
Our Approach: Changes
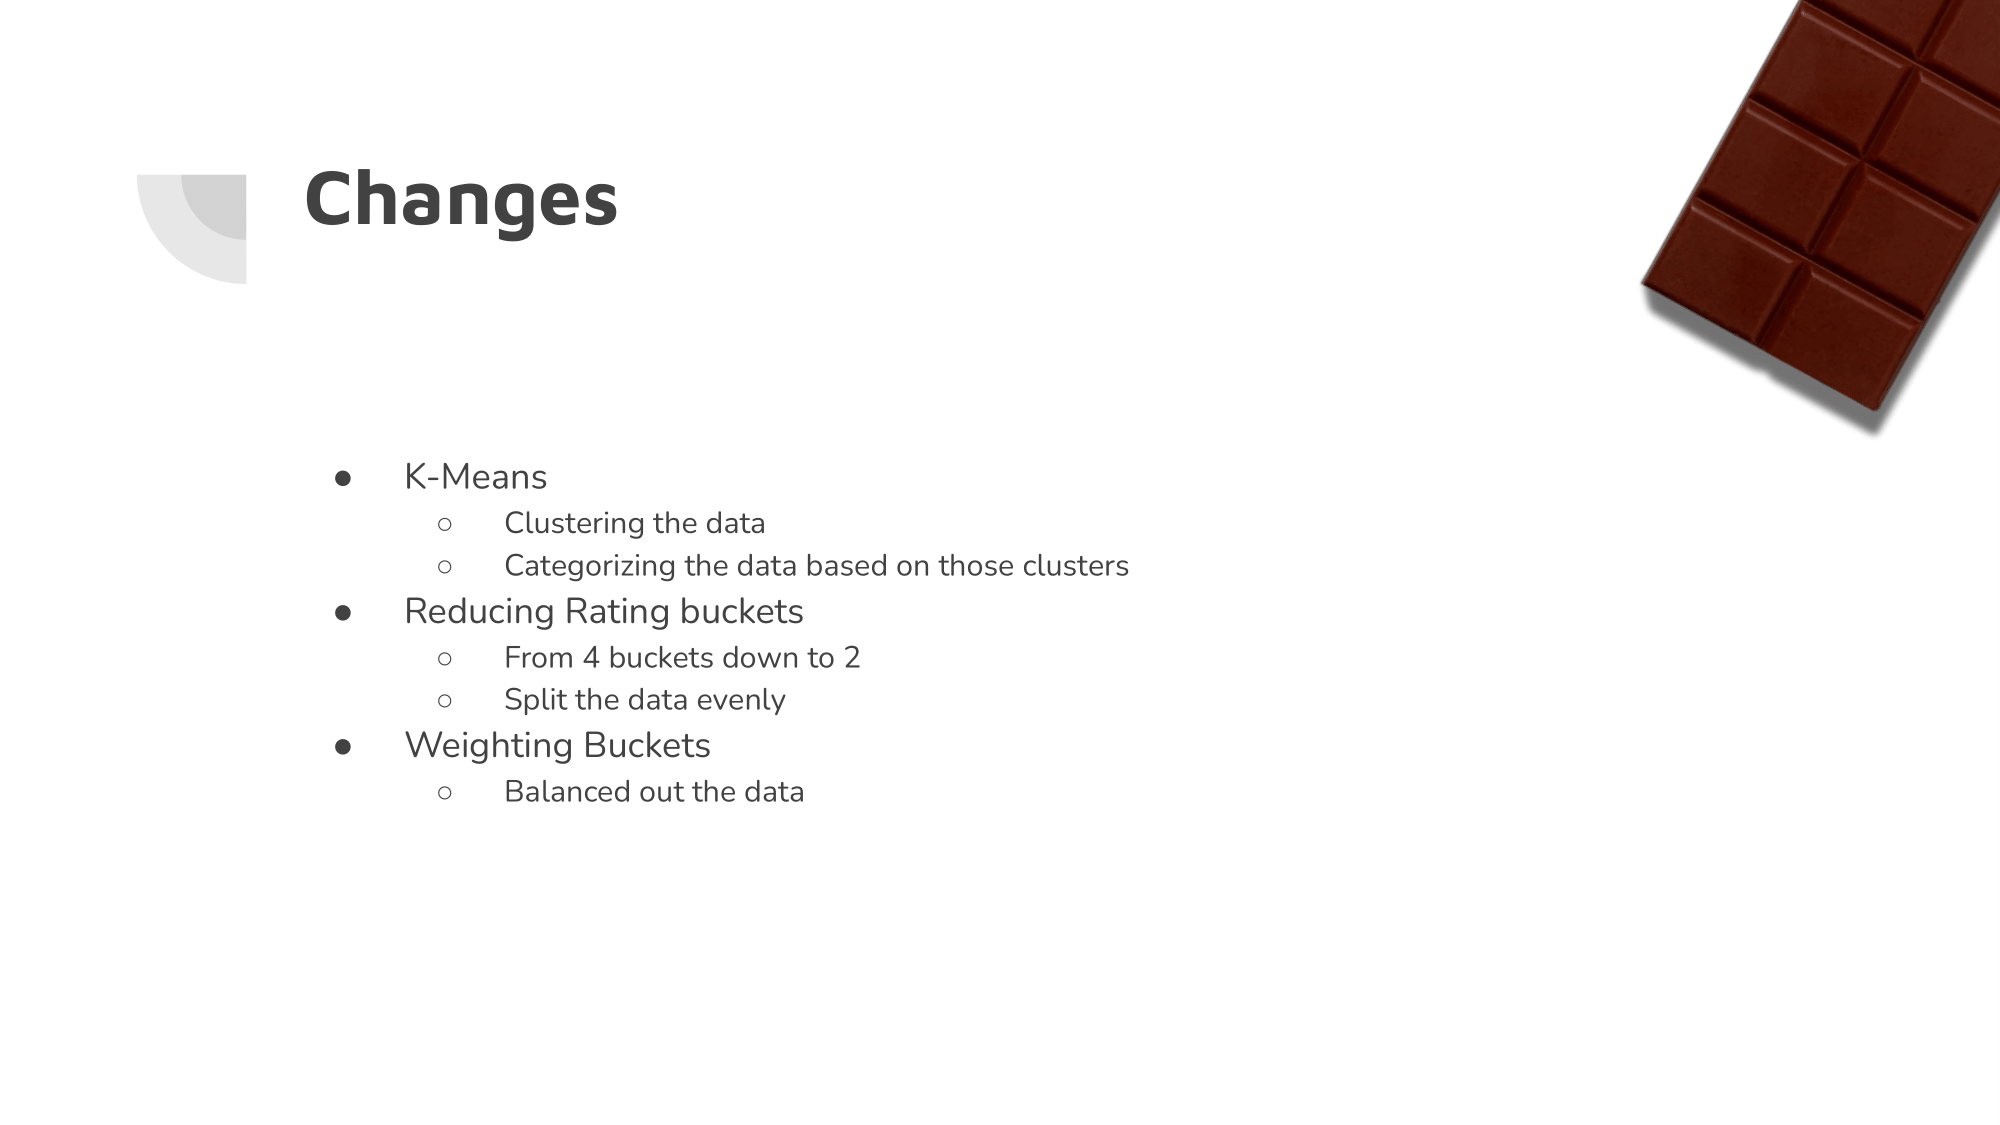
We used K-means clustering in order to better categorize the data. This put the data into groups based on their similarities.
Additionally, we reduced the amount of buckets, and weighted the buckets so that the ‘guessing’ strategy would prove less viable.
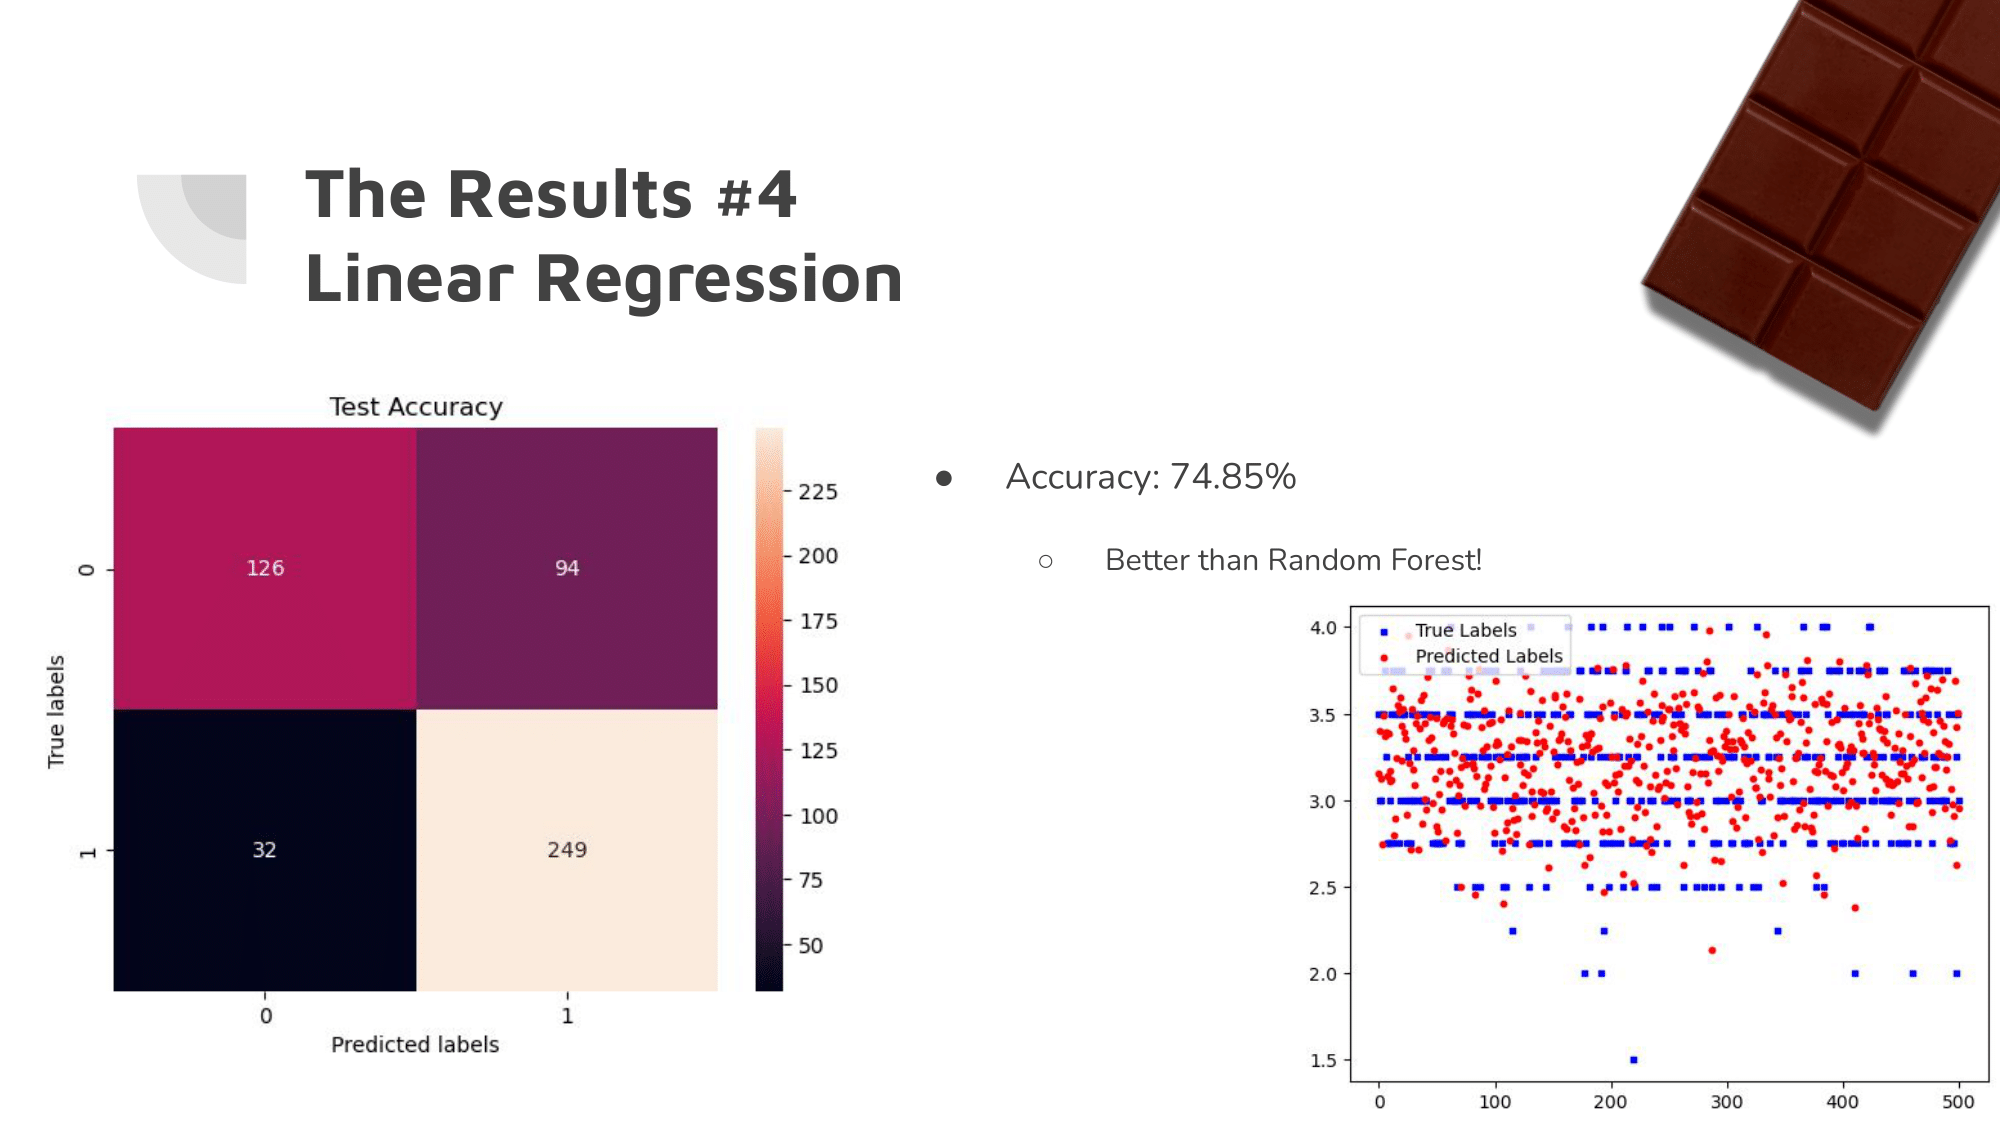
Our Approach: The Results
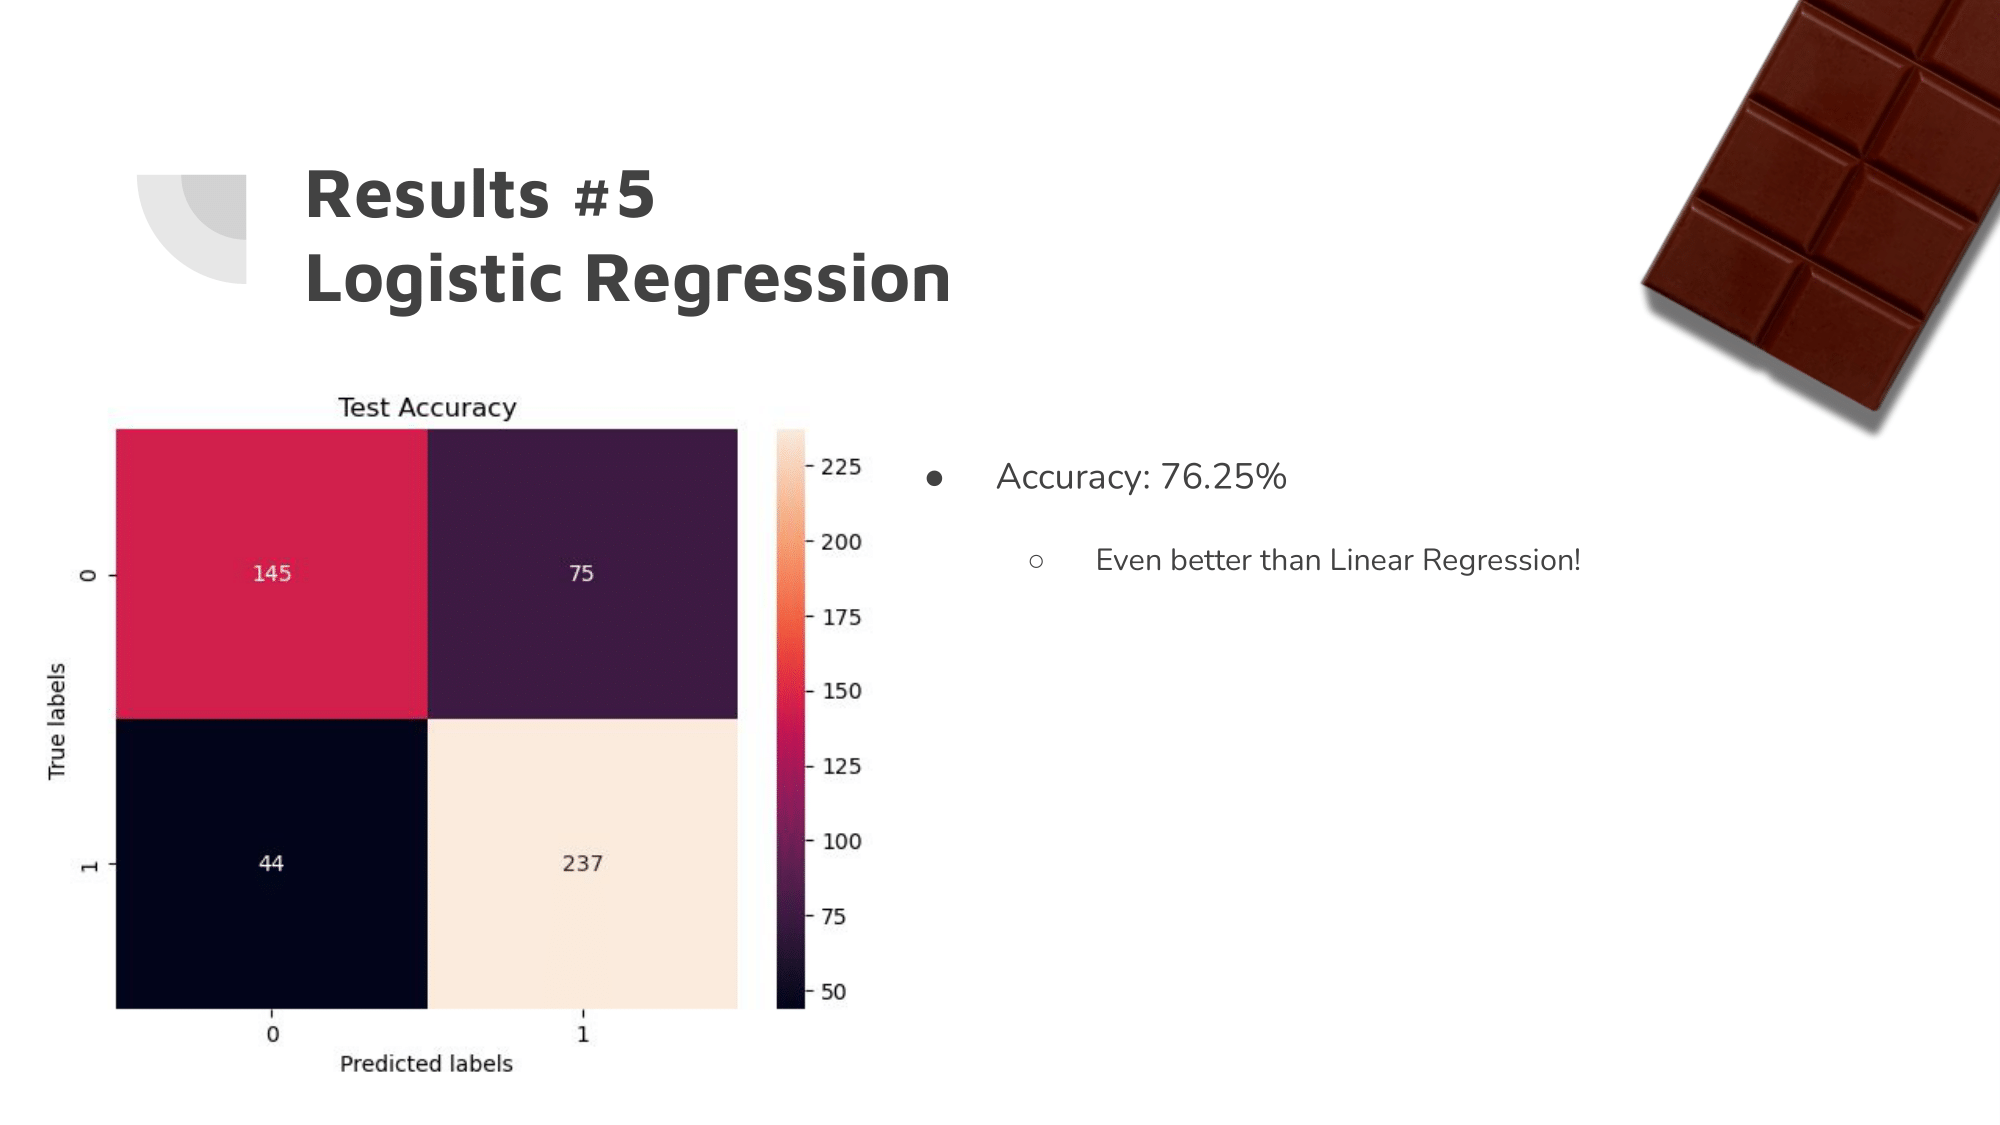
The changes we made improved accuracy by about 14%.
Despite the data being difficult to work with due to the distribution of the ratings and the sheer amount of different dimensions from ‘memorable characteristics,’ we were able to greatly improve the accuracy of our ML algorithms.
Finally, after working with so many characteristics, we were able to find results that no other Kaggle user had.
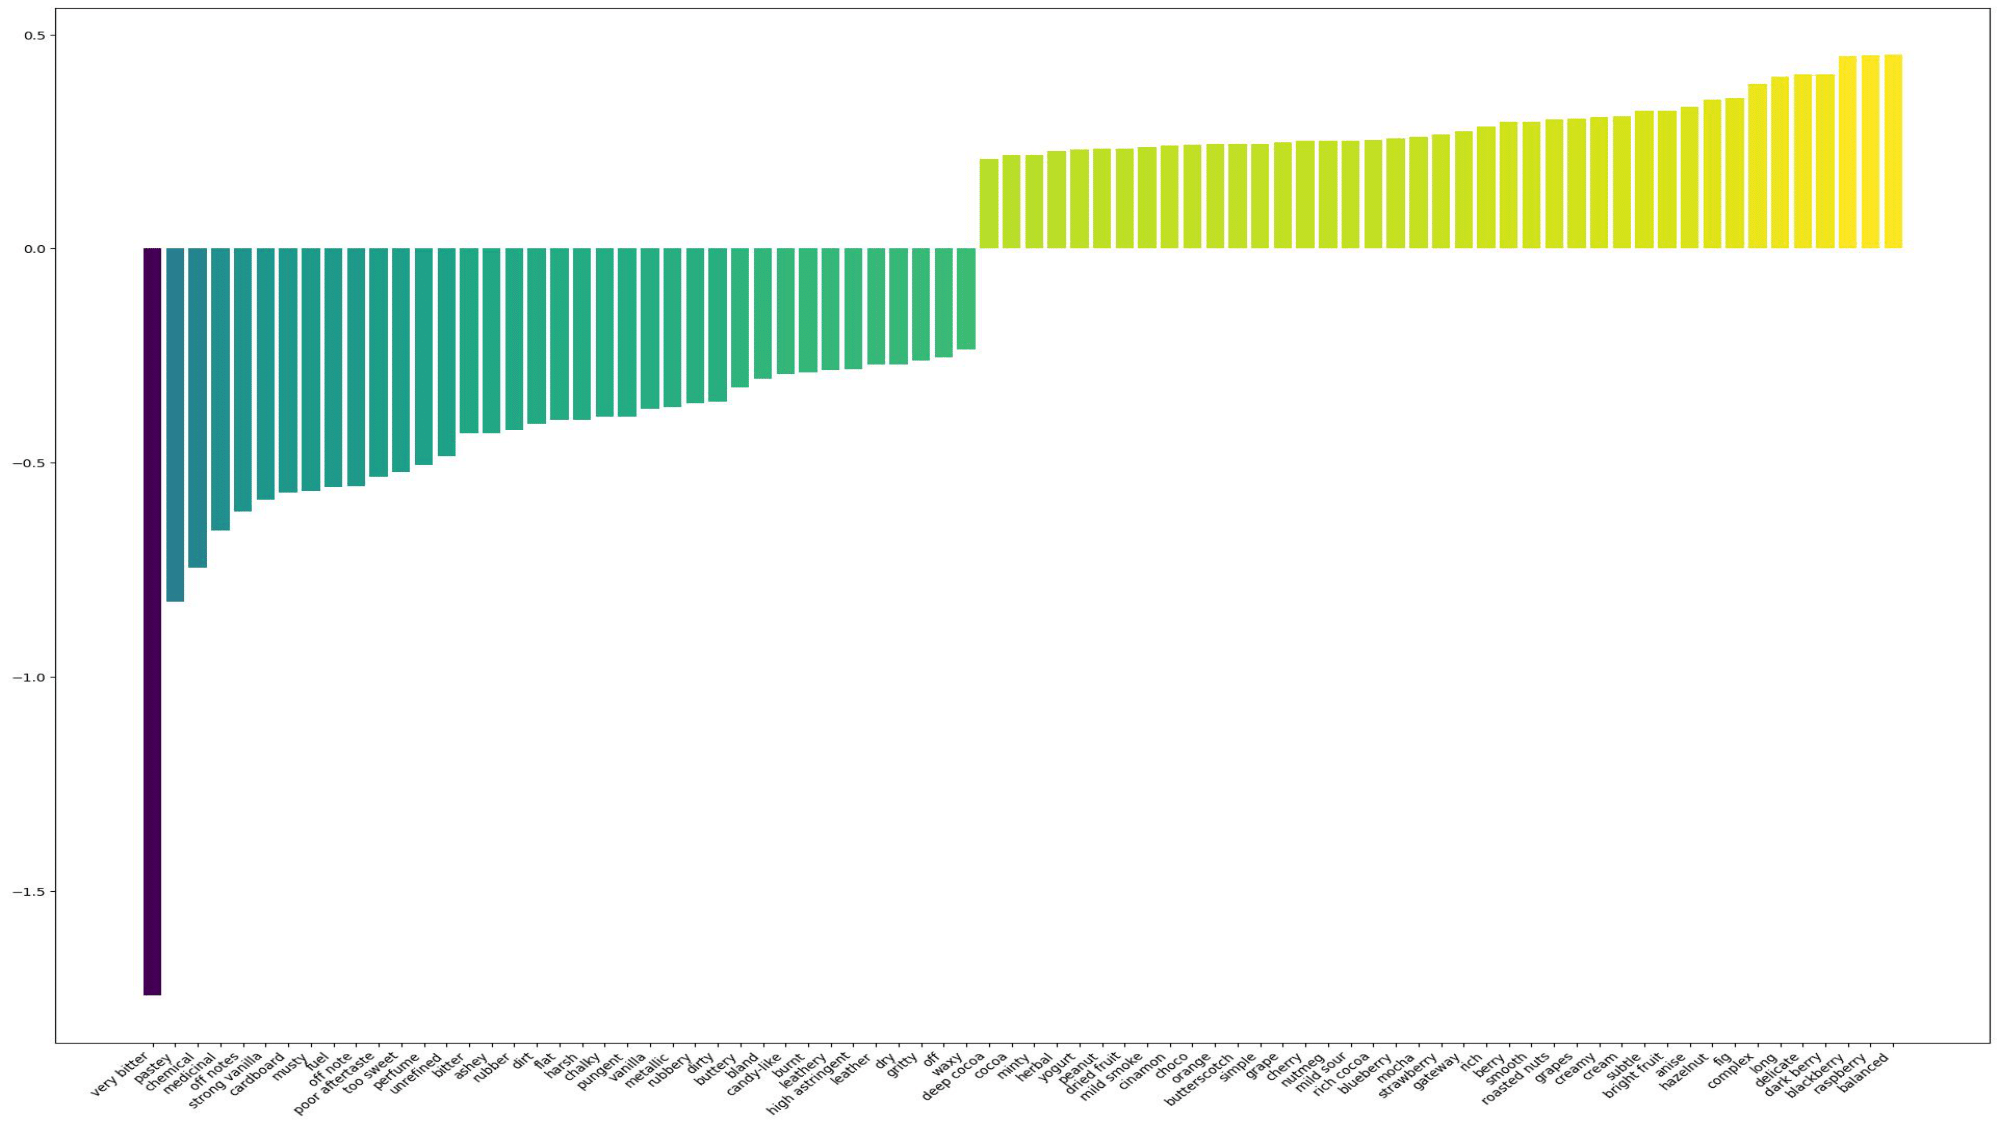
It turns out that a chocolate bar being ‘very bitter’ brings down the rating by about 1.8 on a 5-point scale. Additionally, fruity flavors seem to be the most popular by far, on average bringing up the rating by 0.4 points.
